标签归档:Python

python在ROS中订阅地图消息,在opencv中可视化

在本例中,博主将介绍如何把OccupancyGrid的地图数据在opencv中可视化。

首先,我们阅读OccupancyGrid的文档,可以发现这个结构体主要分为两部分,其MapMetaData存储的是地图的元数据,比如宽度,高度,分辨率等信息。而int8[] data 是一个行主序的数组,数组的值为当前区域被占用的可能性,值域为[0,100],特别地,未知区域的值为-1。

下面是关键部分的示例代码,我们首先订阅一次/map 的消息,并且获取地图元信息,然后我们创建一个numpy数组,并且将可能性的值转换为0-255的颜色。不过在下面的代码中,我将忽略这一特性。所以在probability > 0 这直接写了color=0 ,实际上你可以使用color = (1 – probability) * 255 来代替这一行。最后,因为map_server生成的默认地图未知区域的颜色为205,所以空的numpy数组在一开始用了205来进行填充。

from nav_msgs.msg import OccupancyGrid
map_message = rospy.wait_for_message("/map", OccupancyGrid, 3)  # type: OccupancyGrid
map_width = map_message.info.width
map_height = map_message.info.height
resolution = map_message.info.resolution
origin = map_message.info.origin.position
map_data = np.reshape(map_message.data, (map_width, map_height))
map_rgb = np.zeros((map_width, map_height, 3), np.uint8)
map_rgb.fill(205)
for row in range(map_height):
    for col in range(map_width):
        probability = map_data[row, col]
        if probability == -1:
            continue
        if probability > 0:
            color = 0
        else:
            color = 255
        map_rgb[row, col] = (color, color, color)
map_rgb = cv2.flip(map_rgb, 0)


ROS激光传感器可视化

问题描述

实验平台:TIAGo

编程语言:Python

TIAGo所使用的激光传感器在移动基座的底部,具体的描述信息如下

Laser range-finder

Located at the front of the base. This sensor measures distances in a horizontal plane. It is a valuable asset for navigation and mapping. Bad measurements can be caused by reflective or transparent surfaces.

为了获取激光数据,我们必须订阅/scan 消息,消息返回的类型为sensor_msgs/LaserScan ,该类型的文档可以访问http://docs.ros.org/indigo/api/sensor_msgs/html/msg/LaserScan.html查看,这里为了方便,我直接摘抄这个结构体的描述文档到了下面

std_msgs/Header header
float32 angle_min
float32 angle_max
float32 angle_increment
float32 time_increment
float32 scan_time
float32 range_min
float32 range_max
float32[] ranges
float32[] intensities

其中ranges是一个浮点数组,每个数组成员代表着激光传感器返回的距离,这个距离有可能是inf,因为激光传感器可能会因为没有探测到物体而返回无限远。这个我们需要在后面留意一下。intensities也是一个浮点数组,用来保存对应ranges上的强度。

所有代码如下:

#!/usr/bin/env python

import cv2
import numpy as np
import time
import rospy
from sensor_msgs.msg import LaserScan
import os

def scan_callback(data):
    distances = data.ranges
    angle_min = data.angle_min
    angle_increment = data.angle_increment

    pixels_relative_center = []
    for index in range(len(distances)):
        distance = distances[index]
        if distance == float('inf'):
            continue
        angle = angle_min + angle_increment * index
        x = np.cos(angle) * distance
        y = np.sin(angle) * distance

        pixel_x = int(round(x * 30))
        pixel_y = int(round(y * 30))
        pixels_relative_center.append((pixel_x, pixel_y))

    pixels_relative_center = list(set(pixels_relative_center))

    # create rgb image
    rgb_image = np.zeros((801, 801, 3), np.uint8)
    rgb_image.fill(255)

    pixels_relative_origin = []
    for (pixel_x, pixel_y) in pixels_relative_center:
        col = 400 + pixel_x
        row = 400 - pixel_y
        pixels_relative_origin.append((row, col))

    # draw the point
    for (row, col) in pixels_relative_origin:
        cv2.circle(rgb_image, (col, row), 2, (0, 0, 0), -1)

    # draw the point of robot
    cv2.circle(rgb_image, (400, 400), 4, (0, 255, 0), -1)

    cv2.imshow("rgb", rgb_image)
    cv2.waitKey(30)


def shutdown():
    cv2.destroyAllWindows()
    # noinspection PyProtectedMember
    os._exit(0)


rospy.on_shutdown(shutdown)
rospy.init_node('laser_image', anonymous=True)
rospy.Subscriber("/scan", LaserScan, scan_callback, queue_size=5)
while True:
    time.sleep(1)

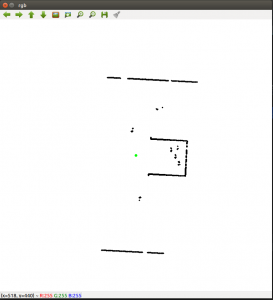
可以持续移动机器人,将会发现数据图随着机器人的变化而变化。

代码讲解

使用循环,每次步进angle_increment 的角度,然后使用了三角函数公式来计算出激光数据点相对于机器人中心点(准确说应该是/base_laser_link,但是这里为了简便就说是中心点了)的坐标x和y。

x = np.cos(angle) * distance
y = np.sin(angle) * distance

为了能够将x,y坐标转换为像素的个数(方便显示),我将他们整体扩大了30倍。实际情况中如果有map,应该结合map的分辨率来计算这个值

pixel_x = int(round(x * 30))
pixel_y = int(round(y * 30))

然后,我们新建了一个801×801的空白画布。这个画布大小是我自己定义的,足够容纳我实验环境下激光传感器返回的所有点。pixels_relative_center 数组保存的是相对于机器人中心点,激光数据点的像素坐标。在后面的循环中,我们将这些数据点转换为相对于画布原点的像素坐标,并将他们放在pixels_relative_origin 数组中。这里需要注意的是,opencv画布坐标轴的位置和方向是不一样的。400就是我们的画布中心点,所以转换方式如下

col = 400 + pixel_x
row = 400 - pixel_y

最后,我们将这些点画出来即可

cv2.circle(rgb_image, (col, row), 2, (0, 0, 0), -1)


Python在linux中输出带颜色的文字

参数说明如下

前景色            背景色             颜色
------------------------------------------
 30                40               黑色
 31                41               红色
 32                42               绿色
 33                43               黃色
 34                44               蓝色
 35                45               紫红色
 36                46               青蓝色
 37                47               白色
显示方式           意义
------------------------------
 0                终端默认设置
 1                高亮显示
 4                使用下划线
 5                闪烁
 7                反白显示
 8                不可见

例子

  1. 这将输出蓝色底,黄色字,带下划线的闪烁文字
    print "\033[1;5;33;44;4mHello, world\033[0m"
  2. 这将输出绿色的Login successful
    print "\033[1;32m%s\033[0m" % "Login successful"
  3. 这将输出红色的Wrong password
    print "\033[1;31m%s\033[0m" % "Wrong password"

Openwrt路由器使用Python自动登录北航校园网

环境配置

关于在Openwrt上安装Python可以参考这里

https://wiki.openwrt.org/doc/software/python

使用本程序请先安装Python

代码内容

在~目录下写buaa.py,内容如下

import urllib
import urllib2
import hashlib
import os
 
 
#Here input your username and password
username = 'xxx'
password = 'xxx'


def check_network():
	response = urllib2.urlopen('http://www.offer4u.cn/ping', timeout=3)
	response.close()
	return response.getcode() == 204

def login(username,password):
	md5 = hashlib.md5()
	md5.update(password)
	password = md5.hexdigest()[8:-8];
	url = 'http://gw.buaa.edu.cn/cgi-bin/do_login'
	values = {'username':username,'password':password,'drop':'0','type':'1','n':'100'}
	data = urllib.urlencode(values)
	req = urllib2.Request(url, data)
	response = urllib2.urlopen(req, timeout=3)
	page_result= response.read()
	response.close()
	if page_result.isdigit() == True:
		return "\033[1;32m%s\033[0m" % "Login successful"
	elif page_result == "password_error":
		return "\033[1;31m%s\033[0m" % "Wrong password"
	else:
		return "\033[1;31m%s\033[0m" % "Unknown error" + page_result

def light(on):
	if on == 1:
		os.system('echo 1 > /sys/class/leds/y1\:blue\:internet/brightness')
	else:
		os.system('echo 0 > /sys/class/leds/y1\:blue\:internet/brightness')
#main
try:
	if check_network() == False:
		light(0)
		result = login(username,password)
		if "successful" in result:
			light(1)
		else:
			light(0)
		print result
	else:
		light(1)
		print "\033[1;34m%s\033[0m" % "Network connection is working"
except:
	light(0)
	print "\033[1;31m%s\033[0m" % "Processing error"

代码解析

  1. 该程序运行时,首先检测网络是否连通(check_network函数),如果网络不连通则进行(login函数),然后根据登录结果输出提示或错误,并控制路由器上的一个灯来表示网络是否连通
  2. 其中http://www.offer4u.cn/ping,这个网址将在网络正常情况下返回204HTTPCODE,这个工作方式和google的类似,本来可以用google.cn的但是由于北航内部有IPV6所以会导致该网址一直处于连通状态,所以用了国内的版本。
  3. 下面这部分是一个shell脚本,用来控制我用的路由器,联想Y1上面的Internet灯的开关,网络连通时让该灯亮起(echo 1),不连通则关闭(echo 0)该灯
    echo 0 > /sys/class/leds/y1\:blue\:internet/brightness

    如果你是其他的路由器,请打开/sys/class/leds/ 目录,找到你想控制的灯,修改y1\:blue\:internet 即可(这里的反斜杠是转义符)
    QQ截图20160304003544
    这款路由器推荐一下非常不错,支持U盘并且内存和运存等配置足够支持运行和安装很多软件,并且价格便宜,我买的时候才70多

  4. 我们可以在编写完后执行python -m py_compile buaa.py ,把py编译成pyc提升性能

持续运行

  1. 在使用的过程中可能会断网,甚至比如北航会在凌晨4点准时断网,所以我们需要启用crontab来持续运行该脚本
    crontab -e

    然后我们输入

    */1 * * * * python ~/buaa.pyc > /dev/null
    */1 * * * * sleep 20; python ~/buaa.pyc > /dev/null
    */1 * * * * sleep 40; python ~/buaa.pyc > /dev/null

    这样就会每隔20秒运行我们的脚本,如果网络断开就会自动连通,其中> /dev/null 是用来关闭输出
    其中Openwrt不会默认启动crontab,我们还需要执行一下命令

    /etc/init.d/cron start
    /etc/init.d/cron enable
  2. 我们可以在连接之后手动登录北航http://gw.buaa.edu.cn/index.php,来查看是否登录成功和用户及流量状况